3.5 Quality assessment and validation
Author(s): Lennart Lindegren
3.5.1 Overview
Author(s): Lennart Lindegren
Assessing the quality of the astrometric data is challenging, given the scarcity of independent data sets that have sufficient quality for a meaningful comparison. The quality assessment and validation must therefore to a large extent rely on various internal checks on the integrity and consistency of the data, and of the adopted models, algorithms, and software. Quality assurance for algorithms and software make use of simulations, test cases, and standard software engineering methods not further discussed here.
Broadly speaking, the quality assessment and validation methods applicable to the astrometric processing can be divided into the following categories.
-
1.
Basic data checks: These include checks on the amount of input and output data (e.g., what percentage of the elementary observations are actually used, and what fraction of the time do they cover) and range checks on all output quantities.
-
2.
Internal consistency: The astrometric processing is essentially a weighted least-squares solution and statistical tests of the residuals (including graphical output such as histograms, sky maps, and scatter plots) can be powerful method to monitor the quality and progress of the data processing and detect potential problems. Ideally, the (weighted) residuals should be unbiased, uncorrelated, Gaussian, independent of other variables, and consistent with calculated uncertainties.
-
3.
Cross-validation: The high redundancy of elementary observations per source makes it possible to partition the data into sets that are to a large extent statistically independent. Processing the complementary data sets separately, and comparing the astrometric results, may give a very good indication of the data quality.
-
4.
Model robustness and diagnostic parameters: While the astrometric model of the sources is unique and immutable, other parts of the modelling involving the nuisance parameters (for the instrument and attitude models) are to some extent arbitrary and the astrometric results should be insensitive to trivial changes e.g. of the attitude knot sequence or break times for the calibration model. Additionally, the astrometric solution may include diagnostic parameters that are expected to be zero if the basic modelling is correct. Examples are colour- and magnitude-dependent centroid displacements. Non-zero values of the diagnostic parameters indicate that the models are inadequate or insufficiently calibrated.
-
5.
Comparison with independent measurements: The astrometric parameters are compared with independent data sets, e.g. from other space missions (Hipparcos) or techniques (VLBI observations). Even if a strict validation of the Gaia results ideally requires external data of similar or better quality, it is in some cases possible to obtain a statistically significant assessment also when the comparison data are less precise.
-
6.
Astrophysical validation: This method relies on astrophysical models of certain kinds of objects. Examples are the parallaxes and proper motions of quasars, parallaxes of distant standard candles (Cepheids, RR Lyrae variables, Miras, etc.), the internal kinematics of stellar clusters, and statistical tests based on the assumed non-negativity of true parallaxes.
The following sections describe the outcome of tests made as part of the validation activities at CU3 level. In many cases the tests use data that are not part of the released data, including alternative solutions and data sets to which the final filtering was not yet applied. A number of the tests are reported in the Gaia DR1 astrometry paper (Lindegren et al. 2016), to which the reader is referred for additional details.
3.5.2 Properties of the astrometric data
Author(s): Lennart Lindegren
The astrometric data in Gaia DR1 consist of two distinct data sets, with very different properties:
-
1.
The primary data set, or TGAS solution, comprises 2 057 050 sources for which all five astrometric parameters (position at the reference epoch J2015.0, parallaxes, and proper motion components) are provided, along with their standard uncertainties, correlation coefficients, and other statistics. This data set is the result of the TGAS solution using positions around epoch J1991.25 from Tycho-2 or, when available, from the Hipparcos Catalogue (van Leeuwen 2007) in order to improve the solution and in particular the proper motions. These sources are typically brighter than . Basic statistics are given in Table 3.4 and Table 3.5.
-
2.
The secondary data set comprises 1 140 622 719 sources down to the Gaia limiting magnitude () for which only approximate positions at J2015.0 are given. This data set was obtained in the secondary solution (Section 4.3) using a mild prior on the parallaxes and proper motions in order to constrain these to reasonable values. Basic statistics are given in Table 3.6.
Additionally, all sources have magnitudes and associated statistics.
| Field | Number | Minimum | 10% | 50% | 90% | Maximum |
| AstrometricDeltaQ | 93635 | 3.77E-05 | 0.332 | 2.35 | 11.3 | 2.04E+04 |
| AstrometricExcessNoise | 2057050 | 0 | 0.299 | 0.478 | 0.855 | 5.3 |
| AstrometricExcessNoiseSig | 2057050 | 0 | 92.6 | 220 | 611 | 1.03E+24 |
| AstrometricNBadObsAc | 2057050 | 0 | 1 | 4 | 9 | 100 |
| AstrometricNBadObsAl | 2057050 | 0 | 0 | 0 | 2 | 70 |
| AstrometricNGoodObsAc | 2057050 | 0 | 54 | 96 | 179 | 1.79E+03 |
| AstrometricNGoodObsAl | 2057050 | 11 | 57 | 99 | 185 | 1.87E+03 |
| AstrometricNObsAc | 2057050 | 0 | 56 | 99 | 186 | 1.87E+03 |
| AstrometricNObsAl | 2057050 | 11 | 58 | 99 | 186 | 1.88E+03 |
| AstrometricPrimaryFlag | 2057050 | true | true | true | true | true |
| AstrometricPriorsUsed | 2057050 | 3 | 5 | 5 | 5 | 5 |
| AstrometricRelegationFactor | 2057050 | 1 | 3.02 | 4.71 | 8.29 | 50 |
| AstrometricWeightAc | 2054858 | 1.53E-06 | 1.92E-05 | 2.76E-05 | 3.53E-05 | 0.00871 |
| AstrometricWeightAl | 2057050 | 0.0351 | 1.32 | 4.1 | 9.87 | 205 |
| B | 2057050 | -89.9 | -36.9 | -1.02 | 34.9 | 89.9 |
| Dec | 2057050 | -89.9 | -59.9 | -4.68 | 54.9 | 89.8 |
| DecError | 2057050 | 0.038 | 0.14 | 0.233 | 0.53 | 18.5 |
| DecParallaxCorr | 2057050 | -0.996 | -0.543 | 0.162 | 0.766 | 0.998 |
| DecPmdecCorr | 2057050 | -1 | -0.888 | -0.586 | 0.126 | 0.999 |
| DecPmraCorr | 2057050 | -0.999 | -0.773 | -0.0009 | 0.771 | 0.999 |
| EclLat | 2057050 | -89.9 | -57.5 | -6.97 | 56.2 | 89.9 |
| EclLon | 2057050 | 1.8E-05 | 44.4 | 190 | 316 | 360 |
| Hip | 93635 | 1 | 1.18E+04 | 5.92E+04 | 1.07E+05 | 1.2E+05 |
| L | 2057050 | 0.000365 | 47.7 | 196 | 323 | 360 |
| MatchedObservations | 2057050 | 4 | 8 | 15 | 25 | 223 |
| Parallax | 2057050 | -24.8 | 0.586 | 1.78 | 4.9 | 296 |
| ParallaxError | 2057050 | 0.204 | 0.242 | 0.322 | 0.644 | 1 |
| ParallaxPmdecCorr | 2057050 | -0.997 | -0.806 | -0.161 | 0.529 | 0.996 |
| ParallaxPmraCorr | 2057050 | -0.999 | -0.858 | 0.0452 | 0.86 | 0.999 |
| PhotGMeanFlux | 2057050 | 307 | 2.46E+05 | 6.24E+05 | 3.17E+06 | 2.83E+08 |
| PhotGMeanFluxError | 2057050 | 1.05 | 109 | 1.03E+03 | 4.38E+03 | 4.36E+06 |
| PhotGMeanMag | 2057050 | 4.4 | 9.27 | 11 | 12 | 19.3 |
| PhotGNObs | 2057050 | 11 | 62 | 115 | 203 | 1.87E+03 |
| Pmdec | 2057050 | -3.16E+03 | -21.5 | -2.94 | 9.11 | 1.86E+03 |
| PmdecError | 2057050 | 0.0118 | 0.441 | 0.867 | 1.96 | 18.9 |
| Pmra | 2057050 | -3.26E+03 | -17.5 | -1.81 | 14.3 | 2.89E+03 |
| PmraError | 2057050 | 0.0118 | 0.5 | 1.13 | 2.67 | 18.3 |
| PmraPmdecCorr | 2057050 | -1 | -0.889 | 0.0103 | 0.882 | 1 |
Notes. Column 1 contains the name of the field, column 2 the number of valid entries in that field for the primary (TGAS) solution, columns 3–7 the extreme values and selected percentiles of the values in the field (50% is the median). The list continues in Table 3.5.
| Field | Number | Minimum | 10% | 50% | 90% | Maximum |
| Ra | 2057050 | 0.000429 | 51.5 | 184 | 318 | 360 |
| RaDecCorr | 2057050 | -1 | -0.774 | -0.021 | 0.775 | 1 |
| RaError | 2057050 | 0.0353 | 0.147 | 0.254 | 0.601 | 19.1 |
| RaParallaxCorr | 2057050 | -0.998 | -0.745 | -0.0428 | 0.739 | 0.998 |
| RaPmdecCorr | 2057050 | -0.999 | -0.781 | -0.00763 | 0.776 | 0.999 |
| RaPmraCorr | 2057050 | -1 | -0.933 | -0.706 | -0.0401 | 0.999 |
| RefEpoch | 2057050 | 2015.0 | 2015.0 | 2015.0 | 2015.0 | 2015.0 |
| ScanDirectionMeanK1 | 2057050 | -180 | -140 | -77.5 | 87.1 | 180 |
| ScanDirectionMeanK2 | 2057050 | -90 | -68 | -0.212 | 67.6 | 90 |
| ScanDirectionMeanK3 | 2057050 | -60 | -46.7 | -7.77 | 46.1 | 60 |
| ScanDirectionMeanK4 | 2057050 | -45 | -40.4 | 0.425 | 40 | 45 |
| ScanDirectionStrengthK1 | 2057050 | 0.000191 | 0.145 | 0.353 | 0.571 | 1 |
| ScanDirectionStrengthK2 | 2057050 | 9.13E-05 | 0.135 | 0.35 | 0.663 | 1 |
| ScanDirectionStrengthK3 | 2057050 | 0.000251 | 0.116 | 0.321 | 0.613 | 1 |
| ScanDirectionStrengthK4 | 2057050 | 0.000305 | 0.183 | 0.515 | 0.897 | 1 |
| SourceId | 2057050 | 7.63E+12 | 7.47E+17 | 3.73E+18 | 6.07E+18 | 6.92E+18 |
| Tycho2Id | 2056312 | 1-1001-1 | – | – | – | 999-999-1 |
| Field | Number | Minimum | 10% | 50% | 90% | Maximum |
| AstrometricExcessNoise | 1140622719 | 0 | 0 | 0.594 | 2.38 | 20 |
| AstrometricExcessNoiseSig | 1140622719 | -6.52E-15 | 0 | 1.13 | 12.7 | 5.86E+05 |
| AstrometricNBadObsAc | 1140622719 | 0 | 0 | 0 | 0 | 43 |
| AstrometricNBadObsAl | 1140622719 | 0 | 0 | 0 | 2 | 578 |
| AstrometricNGoodObsAc | 1140622719 | 0 | 0 | 0 | 0 | 540 |
| AstrometricNGoodObsAl | 1140622719 | 2 | 41 | 71 | 157 | 1.93E+03 |
| AstrometricNObsAc | 1140622719 | 0 | 0 | 0 | 0 | 555 |
| AstrometricNObsAl | 1140622719 | 2 | 42 | 72 | 158 | 1.94E+03 |
| AstrometricPrimaryFlag | 1140622719 | false | false | false | false | false |
| AstrometricPriorsUsed | 1140622719 | 2 | 2 | 2 | 2 | 2 |
| AstrometricRelegationFactor | 1140622719 | 1 | 1 | 1.24 | 7.35 | 191 |
| AstrometricWeightAc | 12481491 | 9.83E-06 | 0.00147 | 0.0407 | 1.33 | 4.08 |
| AstrometricWeightAl | 1140622719 | 0.000314 | 0.0261 | 0.159 | 1.59 | 38.5 |
| B | 1140622719 | -89.5 | -18.1 | -1.6 | 15.2 | 89.1 |
| Dec | 1140622719 | -89.8 | -62.2 | -23.1 | 43.2 | 89.9 |
| DecError | 1140622719 | 0.0277 | 0.256 | 1.57 | 11.3 | 98.9 |
| EclLat | 1140622719 | -90 | -55.5 | -7.43 | 49.4 | 89.8 |
| EclLon | 1140622719 | 0.000179 | 84.8 | 255 | 306 | 360 |
| L | 1140622719 | 0.000205 | 15.6 | 211 | 343 | 360 |
| MatchedObservations | 1140622719 | 5 | 7 | 13 | 26 | 232 |
| PhotGMeanFlux | 1140622719 | 15.7 | 121 | 399 | 4.11E+03 | 2.49E+08 |
| PhotGMeanFluxError | 1140622719 | 0.379 | 1.74 | 2.88 | 9.78 | 2.36E+06 |
| PhotGMeanMag | 1140622719 | 4.53 | 16.5 | 19 | 20.3 | 22.5 |
| PhotGNObs | 1140622719 | 11 | 43 | 80 | 172 | 1.94E+03 |
| Ra | 1140622719 | 4.42E-05 | 93 | 253 | 302 | 360 |
| RaDecCorr | 1140622719 | -1 | -0.839 | 0.582 | 0.99 | 1 |
| RaError | 1140622719 | 0.023 | 0.285 | 1.8 | 12.9 | 99.4 |
| RefEpoch | 1140622719 | 2.02E+03 | 2.02E+03 | 2.02E+03 | 2.02E+03 | 2.02E+03 |
| ScanDirectionMeanK1 | 1140622719 | -180 | -142 | -66.2 | 135 | 180 |
| ScanDirectionMeanK2 | 1140622719 | -90 | -59.7 | -25.4 | 52.2 | 90 |
| ScanDirectionMeanK3 | 1140622719 | -60 | -43.3 | -15.6 | 42.8 | 60 |
| ScanDirectionMeanK4 | 1140622719 | -45 | -42.3 | -4.39 | 42.7 | 45 |
| ScanDirectionStrengthK1 | 1140622719 | 0.000203 | 0.189 | 0.406 | 0.697 | 1 |
| ScanDirectionStrengthK2 | 1140622719 | 7.71E-05 | 0.164 | 0.444 | 0.775 | 1 |
| ScanDirectionStrengthK3 | 1140622719 | 2.89E-05 | 0.157 | 0.409 | 0.699 | 1 |
| ScanDirectionStrengthK4 | 1140622719 | 8.56E-05 | 0.251 | 0.697 | 0.959 | 1 |
| SourceId | 1140622719 | 1.19E+14 | 1.83E+18 | 4.32E+18 | 6.04E+18 | 6.92E+18 |
Notes. Column 1 contains the name of the field, column 2 the number of valid entries in that field for the secondary solution, columns 3–7 the extreme values and selected percentiles of the values in the field (50% is the median). The values are based on a random sample of 1M sources.
3.5.3 Source verification
Author(s): Lennart Lindegren
Basic data checks
The ranges and distributions of the astrometric parameters and various statistics were monitored as part of the internal validation performed by the AGIS team.
Checks of the internal consistency
Residuals of the TGAS solution have been monitored during the iterative solution and extensively studied as part of the internal validation performed by the AGIS teams. See Appendix D of the Gaia DR1 astrometry paper (Lindegren et al. 2016) for a summary of results.
Cross-validation checks
Separate TGAS solutions have been obtained using observations on AF1–AF4 and AF5–AF8, and the resulting astrometric parameters compared. See Appendix E.2 of the Gaia DR1 astrometry paper (Lindegren et al. 2016) for a summary of results.
Checks on model robustness and diagnostic parameters
Several TGAS solutions using alternative models have been obtained and compared:
-
•
Including colour terms in the solution; see Appendix E.1 of the Gaia DR1 astrometry paper (Lindegren et al. 2016).
-
•
Solving the basic-angle variations; see Appendix E.3 of the Gaia DR1 astrometry paper (Lindegren et al. 2016).
-
•
Shifting the attitude knot sequence; see Appendix E.4 of the Gaia DR1 astrometry paper (Lindegren et al. 2016).
-
•
Reducing the attitude knot interval; see Appendix E.4 of the Gaia DR1 astrometry paper (Lindegren et al. 2016).
Comparison with independent measurements
The TGAS solution has been compared with independent measurements from various other instruments:
-
•
Comparison of positions, proper motions, and parallaxes with the Hipparcos catalogue; see Appendix C.1 of the Gaia DR1 astrometry paper (Lindegren et al. 2016). A special study comparing the parallaxes was use to calibrate the external parallax errors of the TGAS solution, from which an ‘inflation factor’ was computed and applied to all the astrometric uncertainties in TGAS; see Appendix B of the Gaia DR1 astrometry paper.
-
•
Comparison with TGAS proper motions; see Appendix C.1 of the Gaia DR1 astrometry paper (Lindegren et al. 2016).
- •
-
•
The TGAS positions, proper motions, and parallaxes of 12 radio stars and one quasar have been compared with VLBI measurements; see Appendix C.4 of the Gaia DR1 astrometry paper (Lindegren et al. 2016).
The secondary solution was checked in a few selected areas using images obtained with the ESO VLT Survey Telescope (VST) for the GBOT project Section 3.2.2 and, for some very high-density areas in the Baade’s window region, with the HST Advanced Camera for Surveys (ACS/WFC). These did not check the astrometric precision of the secondary solution but rather the reality of the stars selected based on the astrometric quality indicators (number of matched observations and excess source noise).
Astrophysical validation
The TGAS solution has been compared astrophysical data for specific kinds of objects:
-
•
The parallaxes of quasars in the auxiliary quasar solution; see Appendix C.2 of the Gaia DR1 astrometry paper.
-
•
The parallaxes of galactic cepheids; see Appendix C.3 of the Gaia DR1 astrometry paper (Lindegren et al. 2016).
3.5.4 Attitude verification
Author(s): David Hobbs
Attitude telemetry from Gaia arrives daily over the mission lifetime. The main processing of Gaia data proceeds over six month cycles. In each cycle new data in blocks of roughly one day must be added to the previous data. At first sight this may look straightforward, however, complications arise as there will be overlaps and gaps between existing blocks of attitude data. Additionally, care may have to be taken when attitude data with different accuracies is combined.
The attitude processing consists of a number of different attitudes with increasing degrees of accuracy as discussed in Section 2.4.5.
-
•
The commanded (requested) attitude.
-
•
The on-board star tracker measured raw attitude contained in telemetry.
-
•
IOGA – The Initial on-ground attitude which is a spline fit to the available raw attitude.
-
•
OGA1 – A Kalman filter designed to smooth the attitude (IOGA) and to improve its accuracy to the order of 50 milli-arcseconds (mas) (see Section 2.4.5).
-
•
OGA2 – A First Look (FL) process does a direct astrometric solution on a single days worth of data resulting in B-splines and quaternions, ODAS (see Section 2.4.5).
-
•
OGA3 – AGIS is the final step in the attitude improvement where all the available observations for primary stars are used together with the available attitude and calibration parameters to iteratively arrive at the final attitude solution with a targeted accuracy of 10 of as (see Section 3.3.4).
Generally, OGA1 and OGA2 data arrive in batches of 1 day but may contain data gaps and may or may not overlap with existing data. Initially, it was proposed to use OGA1 (supplemented by IOGA or OGA2 if OGA1 was not available) as the starting values for the AGIS attitude improvement. However, after some experimentation and due to the patched nature of OGA1-IOGA-OGA2 it was decided to start AGIS from the crude commanded attitude. The convergence of AGIS proved to be very good provided data gaps (see Section 3.3.4) were handled correctly and only a small number of iterations were needed to improve the solution to be better than OGA1.
This also made the verification of the AGIS attitude very simple by comparing the AGIS attitude with commanded attitude in angles and rates about the SRS axes. Checking for range out of bounds (extreme values) and checking for attitude spikes (manual inspection). RSE values of the differences between the starting values and the current values are plotted in the AGIS monitor and the updates in the attitude are also plotted. Sampling of about 1/5 of a knot interval is needed. Additionally, manual checks of the attitude around dead times and manual checks on extra knots could be performed.
3.5.5 Geometric calibration verification
Author(s): Alex Bombrun
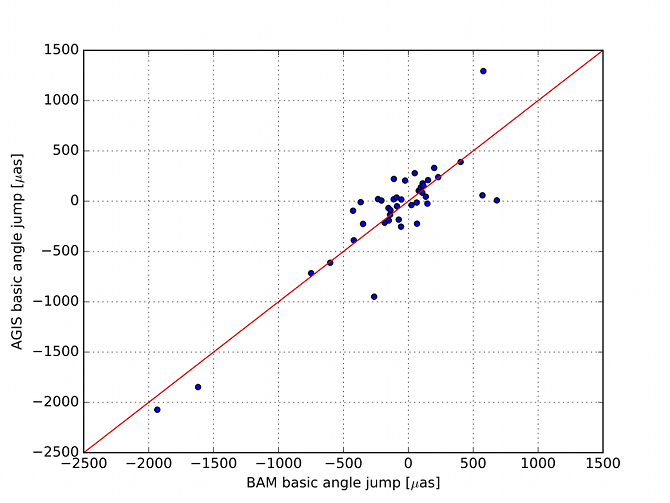
The geometric calibration model is described in Section 3.3.5. The first verification consists in the analysis of the fitted values for the geometric calibration model. In particular one can compute the basic angle offset contained in this model (See Equation 19 in Lindegren et al. 2012). The BA changes are consistent with the payload activities described in Section 1.3.3. The four major payload events (the two de-contaminations and the two refocusing, Table 1.3) correspond to the 4 major jump of the basic angle offset visible on (See Figure (A.1) in Lindegren et al. 2016).
Basic angle jumps have not been included in the basic angle correction based on harmonic analysis of BAM data. However, 44 calibration break points have been set at the time of largest basic angle jumps identified in BAM data, see Section 3.2.5. Consequently the amplitude of these jumps was fitted in the geometric calibration model. (See zoom of Figure (A.1) in Lindegren et al. 2016) and Figure 3.10, both show that there is good agreement between the fitted amplitudes (AGIS) and the measured ones (BAM).
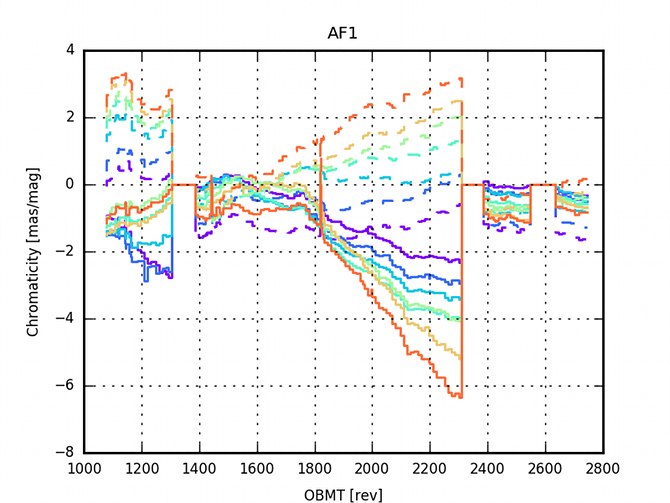
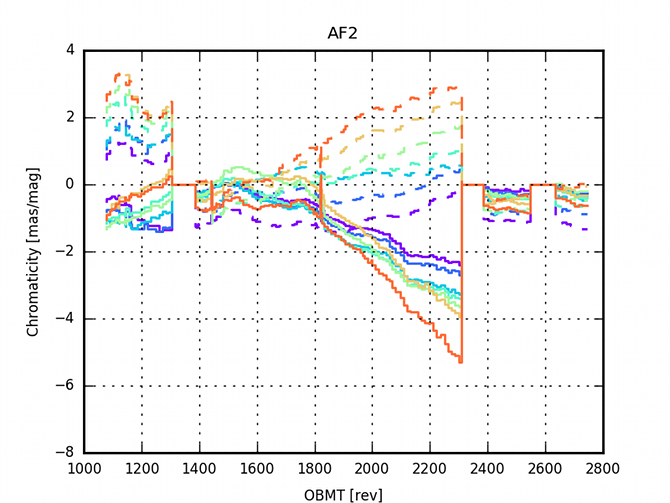
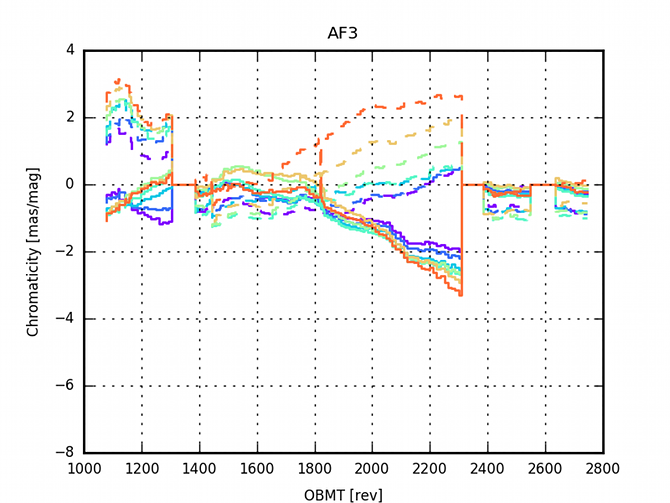
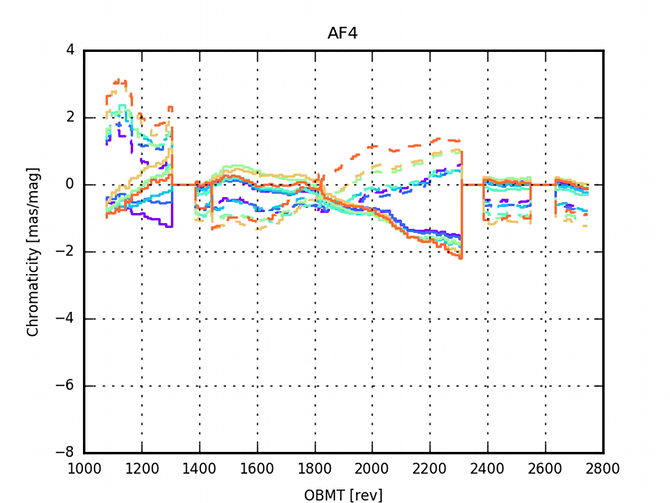
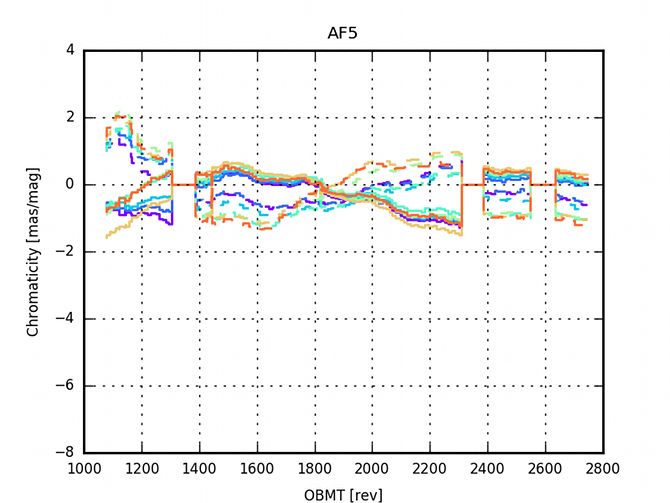
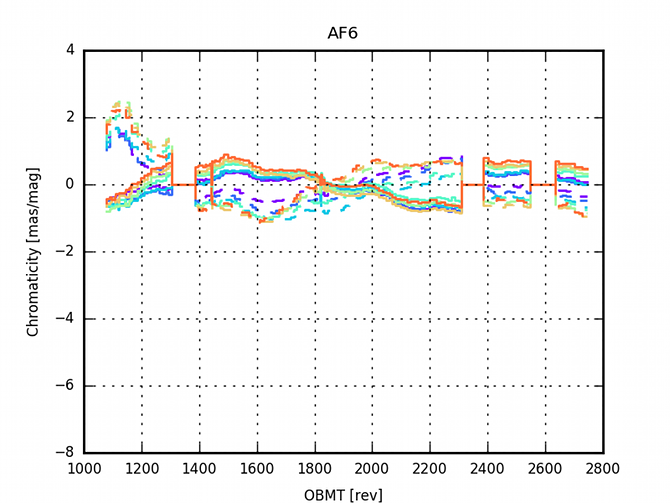
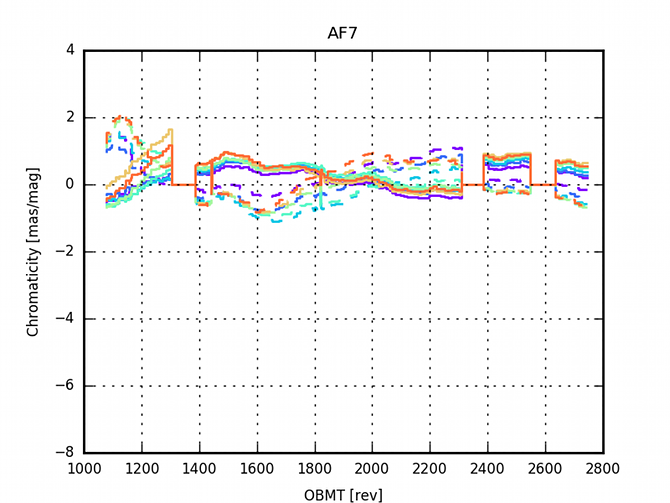
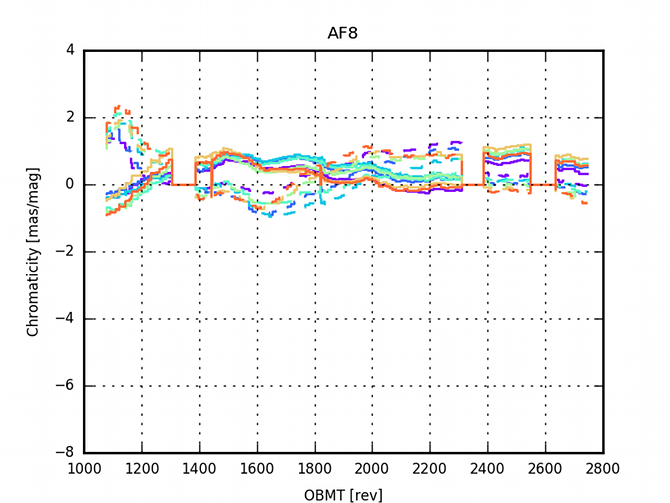
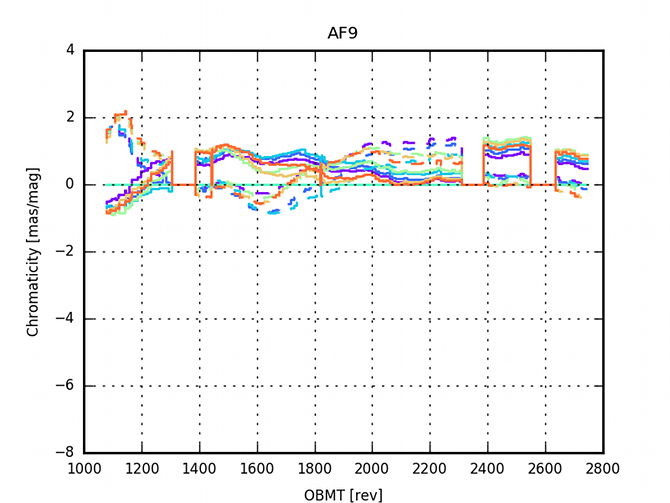
The AGIS residuals are analysed to investigate the limitation of the current model. In particular there are large correlations within the residuals due to some colour dependencies (See Figure (D.2) in Lindegren et al. 2016). A validation run with colour-magnitude effects added to the nominal calibration model was computed (See Appendix (E.1) in Lindegren et al. 2016, for a detailed analysis). Figure 3.11 and Figure 3.12 show the evolution of the colour calibration in the validation run over the focal plane. The effect is larger in AF1 than in AF9 and in row 7 than in row 1. Additionally the effect is time dependent, none the less, it seems to be stabilised after the last decontamination.
3.5.6 Comparisons of alternative solutions
Author(s): Lennart Lindegren
3.5.7 Correlations in the Gaia data
Author(s): Lennart Lindegren
Correlations among the astrometric data exist on several different levels, e.g.:
-
•
within-source correlations (between the different astrometric parameters of the same source);
-
•
between-source correlations (between the same astrometric parameter, e.g. parallax, for different sources);
-
•
general correlations (between arbitrary astrometric parameters of different sources).
Within-source correlations are always provided, when relevant, in the Gaia Archive. They are estimated from the normal matrix of the individual sources. Because they are computed by neglecting the between-source correlations, they are only approximations of the actual within-source correlations, but probably sufficiently good for all astrophysical applications. They are principally needed when transforming the five astrometric parameters to other representations (e.g. calculation of galactic coordinates, tangential velocity, or epoch transformation).
Between-source correlations are important when calculating quantities that depend on several sources, such as the mean parallax or internal kinematics of a stellar cluster. In the final Gaia data such correlations are expected to be important mainly on small angular scales (less than a few degrees), but in Gaia DR1 they could exist on much larger angular scales (tens of degrees).
Between-source correlations and general correlations are much harder to estimate than the within-source correlations, principally because their rigorous calculation would involve the inversion of extremely large matrices. Approximate methods to estimate general correlations exist (e.g. Holl and Lindegren 2012; Holl et al. 2012) but have not been implemented in the Gaia data processing. Empirically, the between-source correlations can be estimated by analysing the spatial correlations of the astrometric residuals, or from statistical analysis of the parallaxes and proper motions for distinct groups of sources, such as in stellar clusters and quasars. For Gaia DR1 the between-source correlations have not been extensively studied but they are believed to be very significant and arising mainly from modelling errors in the attitude or instrument. A limited correlation study of the astrometric residuals in Gaia DR1 is reported in Appendix D.3 of Lindegren et al. (2016).
3.5.8 Comparisons with space-based astrometry
Author(s): Lennart Lindegren
See Section 3.5.3.
3.5.9 Comparisons with ground-based astrometry
Author(s): Uli Bastian
The results of the astrometric solution were compared with ground-based astrometric data. As expected, this essentially showed the precision and the systematic errors of the ground-based data, rather than contributing to the validation of the Gaia astrometry. The sole exception are the VLBI positions of quasars, which both gave a confirmation of the quality of the Gaia solution, as well as a first mas-level information on the typical offset between the optical and the radio centres of light for quasars.
3.5.10 Astronomical checks of the data
Author(s): Uli Bastian
In addition to the above-mentioned direct comparison with ground-based astrometry, other prior consensus knowledge on distances and motions of stars was used to verify/validate the Gaia DR1 astrometry. Among the source classes and criteria used for this purpose are:
-
•
LMC & SMC members as a (regional) check on the parallax zeropoint
-
•
quasars as a (global) check on the parallax zeropoint
-
•
distant Cepheids and RR Lyrae stars as a (global) check on the parallax zeropoint
-
•
quasar positions as check against the ICRF (as mentioned above already)
-
•
quasars as a check on proper-motion precision at the faint end
-
•
stellar aggregates (LMC, SMC, star clusters) as a check on proper-motion precision at the bright end
-
•
stellar aggregates as check on colour- and magnitude-dependent biases
-
•
negative-parallaxes tail as check on parallax precision
3.5.11 Conclusions
Author(s): Lennart Lindegren
The various quality assessment and validation procedures give confidence in the overall correctness of TGAS and the secondary solution, but also indicate many weaknesses and problems that have to be addressed and removed in subsequent releases. Some of the important caveats concern the completeness of the data (e.g. missing bright stars, high proper motions stars, and faint stars in high-density regions) and the presence of systematic errors. The TGAS parallaxes, for example, are expected to have position- and colour-dependent systematics on the level of mas. These systematics are strongly correlated for stars within areas of several degrees, which means that they cannot be reduced by averaging e.g. in a cluster. It is probable that the position and proper motion errors have similar systematics, although this is more difficult to determine. For individual sources the stated standard uncertainties of the astrometric parameters appear to be fairly reliable in the primary data set (TGAS), while the positional uncertainties in the secondary data set appear to be underestimated.