4.5.4 Verification of colour indexes
Author(s): Alberto Cellino
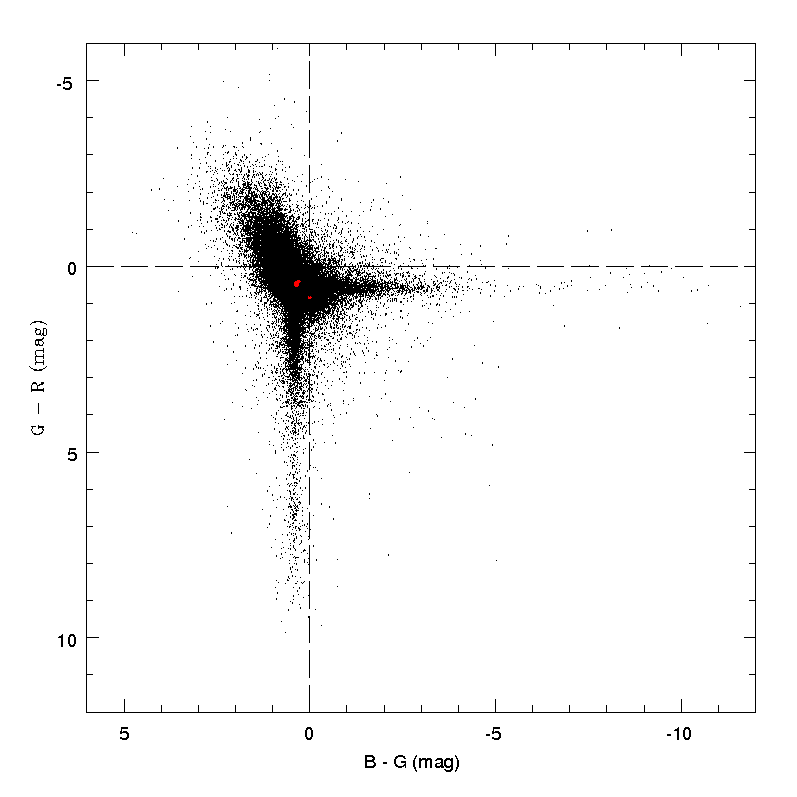
Each point in the plot of the vs. colour indexes shown in Figure 4.30 corresponds to one of the 233 821 transits recorded for a set of 14 099 SSO. This plot shows the presence of a ’central core’, corresponding to what should be expected for normal SSOs, as shown by the colour indexes of 32 stars of solar type, shown in the Figure as red dots. A large number of aberrant transits are well visible, however. Many of them are located in two perpendicular strips, corresponding to transits having either a ’normal’ colour index, but showing a huge interval of possible , or just the opposite. The nearly vertical strip corresponds to transits in which either the flux seems to be anomalously high, or both the and flux are anomalously low (resulting in a ’normal’ colour index). Conversely, the nearly horizontal strip corresponds to transits in which both the and are low (in such a way to keep a ’normal’ colour index), or the flux is much higher than expected. Note also the presence of a region of the plot (top-left) in which it seems that the recorded colours at these transits are bluer than normal, whereas the colours at the same time are redder. These transits seem to be characterized by anomalously bright values of the flux in mag, with respect to both and . Such flux anomalies/losses in a number of different transits cannot be easily explained. In principle, it is expected that flux losses due to the apparent motion of the objects play a fundamental role (see Section 4.5.3).
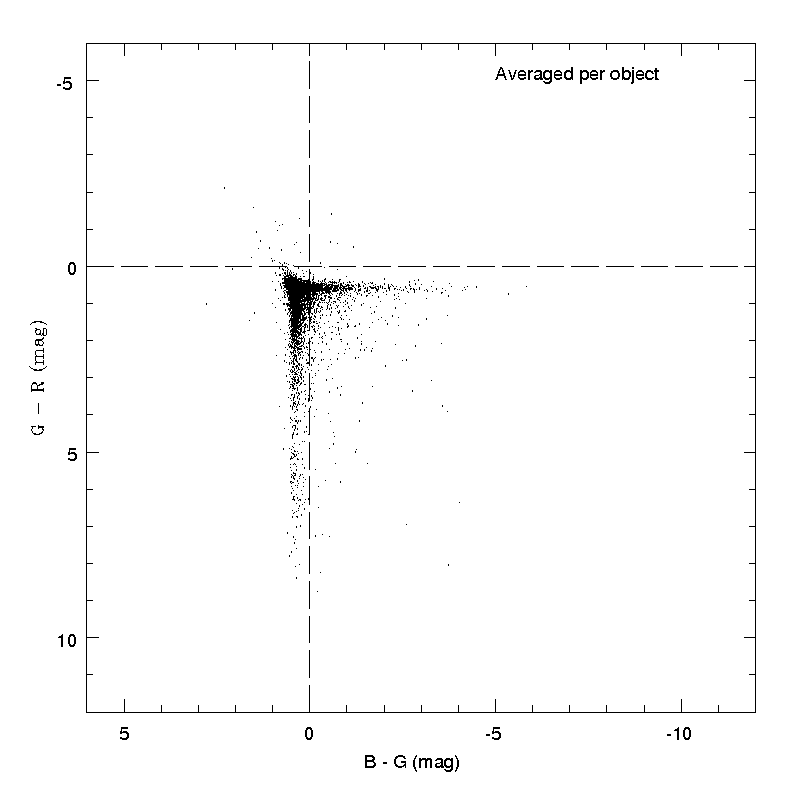
Since these unexpected effects concern a large number of single transits, it is interesting to see what happens if one makes the same plot, but averaging over all the recorded transits of each different object. This is shown in Figure 4.31, in which we show the weighted averages of all the different transits recorded for each single object in same data-set considered in Figure 4.30. The result of this exercise is a much ’cleaner’ behaviour. The two anomalous ’strips’ visible in Figure 4.30, however, are still well visible. It seems therefore that a fraction of transits recorded for many objects in the data-set are characterized by anomalous recorded fluxes, either in or in , or or in all of them, as expected if flux losses due to the motion of the objects play an important role (see Section 4.5.3). In many cases, averaging over all transits tends to produce colour indexes that are ’normal’. In many other cases, however, even the averaged colour indexes appear to be anomalous, possibly indicating the presence of anomalies in single transits that are sufficiently numerous and/or big to affect the average behaviour.
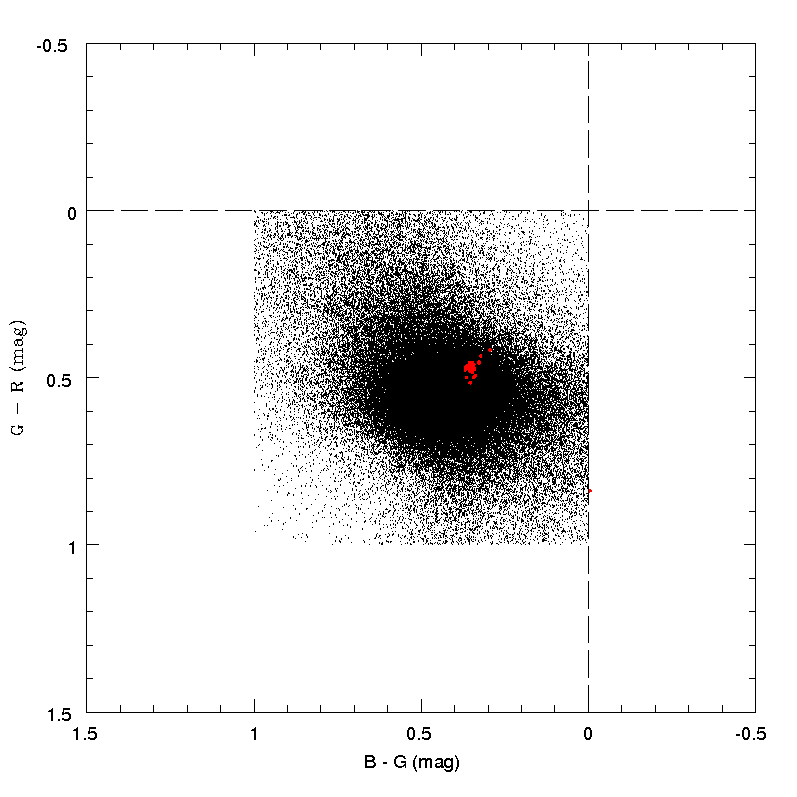
The above results suggest a criterion of rejection based on the behaviour of the colour indexes. In defining such a rejection filter, we have to reach a compromise in order to avoid to be exceedingly conservative, rejecting too many transits, but keeping at the same time the accepted range of colour indexes within reasonable limits. Eventually, it was decided to accept all and only the transits for which both the and the colour indexes have values between 0.0 and 1.0. We also continue to require that the nominal error of the mag is less than 0.1 mag (equivalent to a maximum permitted value of about 0.1 for the relative error of the flux). The set of accepted transits is graphically shown in Figure 4.32. Correspondingly, the total number of accepted ’gold + silver’ transits decreases from 233821 to 148456. This means a very significant filter. To summarize, we define the following photometry rejection filter: SSO photometric data are accepted only if the two following conditions are met:
-
1.
The nominal error in the determination of the magnitude is less than 0.1 mag;
-
2.
Both the and colours must have values in the interval between 0.0 and 1.0 magnitudes.