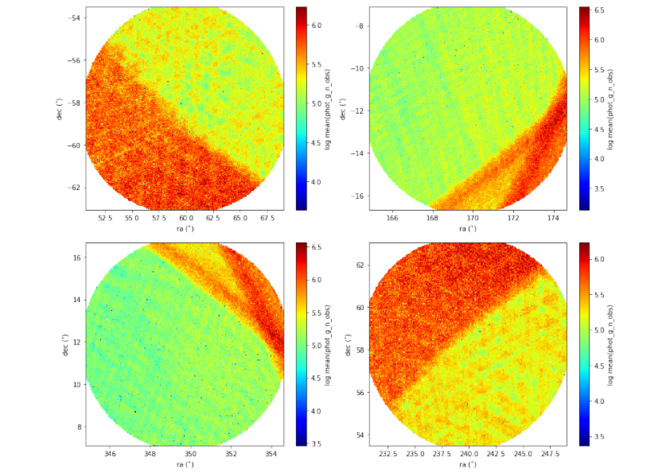
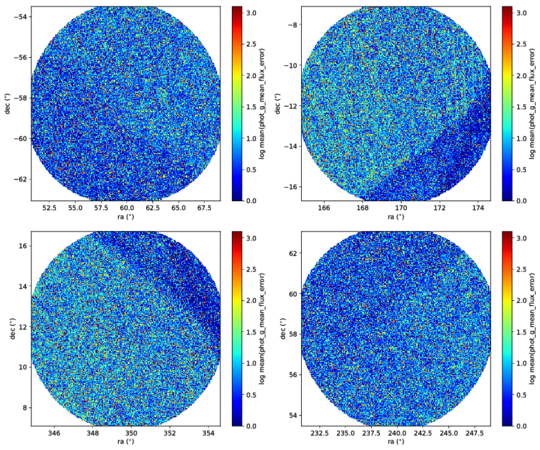
10.5.1 Two-dimensional distribution test
We have first computed the 2D distributions of each photometric and astrometric observable, uncertainty or uncertainty correlation in the selected sky regions.
We find the 2D distributions of the observables to follow expectations given their location on the sky (e.g., colour-magnitude diagrams to be symmetric with respect to Galactic latitude at fixed longitude). On the other hand, the 2D distributions including uncertainties and correlations are similar between ‘patch-a’ and ‘patch-d’ (regions of high number of transits) on the one hand, and ‘patch-b’ and ‘patch-c’ (regions of low number of transits) on the other. This confirms the expectation that the number of transits/observations in a region reflects on the amplitude of the errors, with smaller errors corresponding to regions with larger number of transits (compare for example, Figure 10.32 and 10.33.