7.4 Catalogue validation
7.4.1 Introduction
Author(s): Frédéric Arenou
Despite the precautions taken during the acquisition of the satellite observations and when building the data processing algorithms, completely avoiding errors in the astrometric, photometric, spectroscopic or classification data in a one billion source catalogue, with many intricate data for each, is an impossible task. However, several actions have been undertaken to improve the quality of the Gaia Catalogue through a data validation process before each release.
It is fundamental to note that the first step of this validation is logically represented by the many verification tests implemented in every Gaia DPAC Coordination Unit (CU) before producing their data, and which are described in the previous chapters, Section 3.5 for the astrometry, Section 5.5 for the photometry, and Section 6.5 for the variability. A second and last step, which is developed below, is the CU9 Catalogue validation, i.e., what is being done after collecting the various CU data and building the Catalogue before publication.
A large effort has been dedicated to the Catalogue validation, with the following main purposes for the validation tests:
-
•
implement general sanity checks on the fields of the Catalogue
-
•
check the accuracy and precision of the Catalogue parameters
-
•
verify the correct distribution of these parameters, in particular the absence of large numbers of outliers
-
•
study the completeness of the Catalogue
-
•
detect as much as possible instrumental or data processing problems
-
•
and more generally check what would not be covered by the internal CU verifications, i.e., in particular, cross-CU checks.
While the DPAC is mostly organised in terms of astronomical fields (astrometry, photometry, spectroscopy, etc.), the validation areas have been split in terms of various methods which can be applied, with the purpose of being able to make a cross-check of the different results obtained with the different methods.
These methods are described in turn in the sections below and each have their pros and cons. Internal methods, using only the Gaia data, can be applied to any star without any crossmatch ambiguity. On the other hand, external catalogues provide independent results which can be compared to the Gaia data. And, where external data are not available, galaxy models may sometimes help to explain whether observed features are, or not, artifacts. Also, statistical methods for multidimensional analysis can find data properties inside the observational noise. Finally, while this validation development model is transversal, some special objects require a special treatment, such as clusters, and those having an important time dependence such as variability analysis, and also solar system objects. Dedicated sub-work packages led by experts of the fields above have been settled to provide the needed insight on the Catalogue quality.
In the following sections, we describe the methods which have been applied, together with the results mostly obtained on preliminary data, and which contributed to improve the Gaia DR1 Catalogue. At the time of the DR1 release, this chapter described all the validation results, in order to give the needed information to the users. These results have now been published as part of the A&A Gaia Special Issue (Arenou et al. 2017) and this chapter refers to this publication or give complementary details.
7.4.2 Internal comparisons
Author(s): Claus Fabricius, Frédéric Arenou, Krzysztof Findeisen, Sergio Soria
The internal comparisons consist of a number of consistency tests that can be carried out without reference to external data. This includes e.g., basic sanity checks, identification of features in the data related to the way observations were made, checks on the shape of the negative parallax tail, and so on.
Sanity and consistency
The most fundamental validation tests verify that values given are not obviously wrong. This kind of check can catch simple mistakes in data manipulation, like missing data fields, wrong units, or erroneous conversions. Such tests are mandatory, because data pass between several data processing centres and through many steps after the specific processes (astrometry, photometry, etc.) before eventually reaching the data release data base.
Main data integrity and consistency tests are described in Section 2.2 of the Catalogue validation paper (Arenou et al. 2017), and we mention in what follows several other tests which were not discussed or illustrated in this publication.
Magnitude consistency
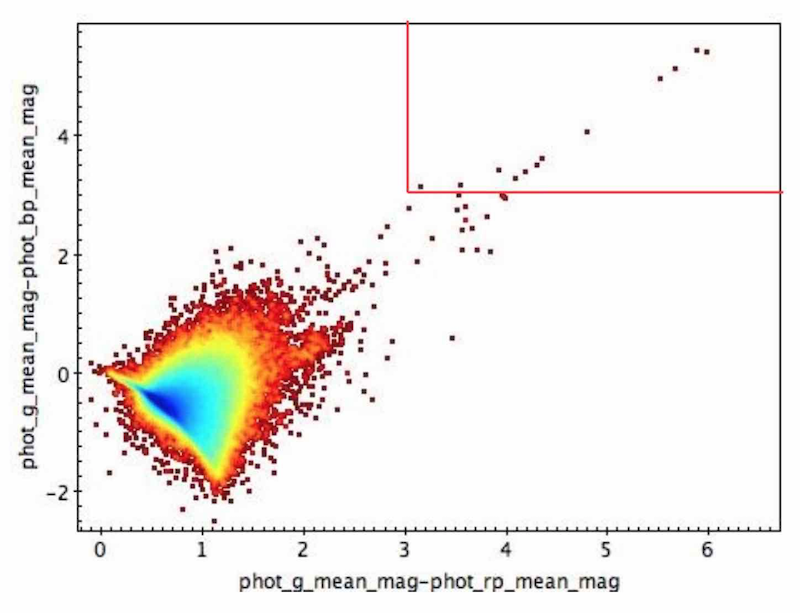
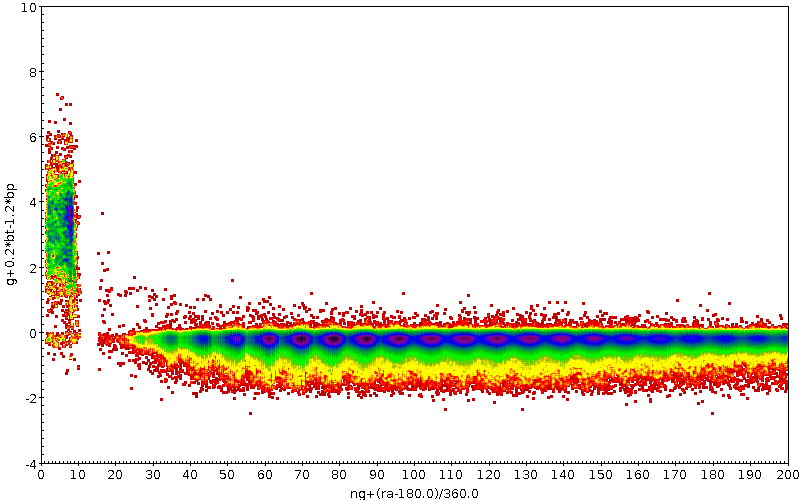
-band photometry was tested both by looking for unexpectedly faint sources in the TGAS subset (2 381 sources with mag) and by comparing the magnitudes to preliminary versions of photometry to be published in later releases ( and ). Before GDR1, CU9 validation removed many sources with anomalous magnitudes from the final release, but the filtering was conservative due to uncertainty in the cause and extent of the problem. For example, when colour information was available, stars with and , (Figure 7.1a), thus where a problem with was suspected, were filtered (164 446 sources). Faint TGAS stars frequently had a small number of observations (less than 10), and stars with less than 10 observations clearly behaved differently in photometry (Figure 7.1b) so they were also filtered (746 292 sources).
 |
 |
The rest of the filtering process is discussed in Section 3.1 of the Catalogue validation paper.
Duplicate sources
An important test checked that there were no duplicate sources in the data release. If a single source had two entries in the input source list, had a second entry recorded during source identification, experienced crossmatching problems with a nearby (real) source, or encountered other processing problems, the process for matching observations with sources could have distributed the observations of this single source between two or more source entries. These duplicate sources which have been removed by the validation filtering are described in Section 3.2.1 of the Catalogue validation paper.
Angular resolution
The effective angular resolution of a catalogue is studied in Section 4.4.1 of the Catalogue validation paper using the distribution of the distances between pairs of sources.
Formal quality
The Gaia catalogue provides errors and goodness of fit metrics for its astrometric solution; the catalogue validation process included several checks of these errors that could be done without reference to external data. These included examining the astrometric goodness-of-fit fields and checking that solutions did not mix high and low precisions on different parameters. Gaia DR1 contains 5 and 2 astrometric parameter solutions for TGAS and Gaia secondary sources, respectively.
Focusing on the 5 parameter solutions for TGAS, they have been broken up into Hipparcos and Tycho-only subsets. A 0.012% of Hipparcos sources contain astrometric errors exceeding 10 mas in position, 10 mas yr in proper motion, or 5 mas in parallax. Using the same criterion, 0.067% of the Tycho-only sources supersede some of these thresholds.
In Table 7.3 we compare the uncertainties for the remaining sources with the ones expected for a TGAS based on only 0.5 years of Gaia data, as discussed in Michalik et al. (2015, Tables 2 and 1). The actual TGAS errors for Tycho-only stars are better than expected, probably because we have 1.15 years of data instead of the 0.5 years in the simulation. The much smaller errors for Hipparcos are more susceptible to the imperfections of the Gaia DR1 processing and the (insufficient) five parameter model for astrometry.
| Hipparcos | Tycho | |||||
| Simulation | TGAS | Simulation | TGAS | |||
| right ascension | 0.147 | 0.229 | 0.332 | 0.257 | ||
| declination | 0.147 | 0.218 | 0.332 | 0.234 | ||
| parallax | 0.244 | 0.283 | 0.631 | 0.324 | ||
|
0.034 | 0.064 | 1.259 | 1.172 | ||
|
0.034 | 0.056 | 1.259 | 0.891 | ||
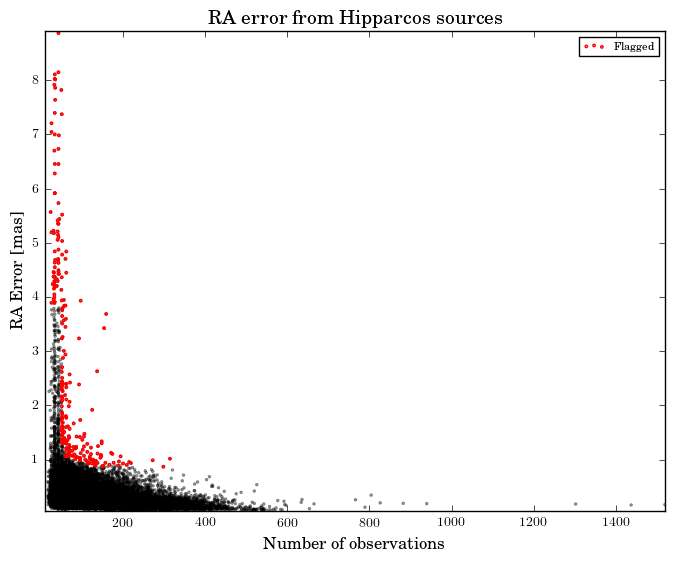
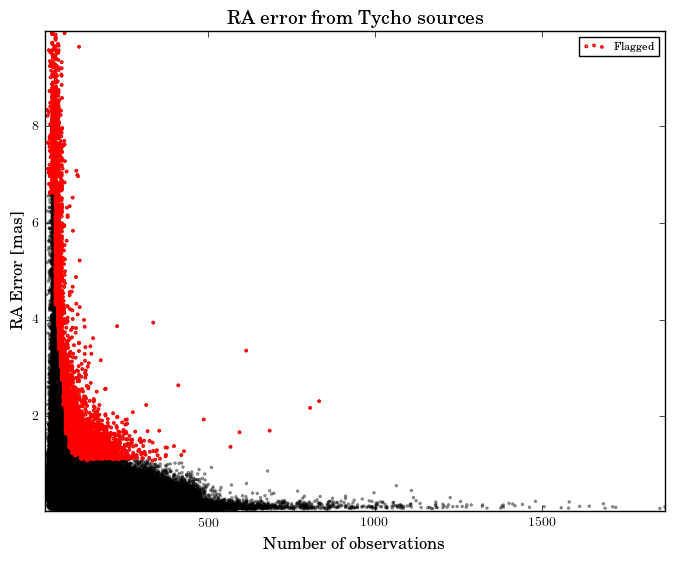
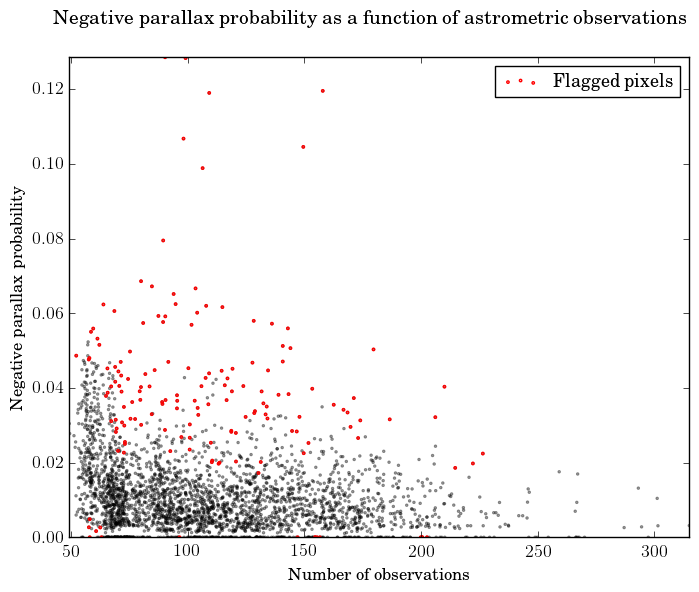
In addition, we have checked for TGAS the size of the astrometric standard uncertainties as a function of the number of observations. An example is shown in Figure 7.2, where the red points correspond to solutions where is further from the median value at that number of observations, than twice the distance from the median to the 2nd or 98th percentiles. The fraction of such outliers never exceeds 0.6% for any of the TGAS parameters. We note that due to the different scan orientations for different observations, we cannot expect a simple square root dependence with the number of observations. We also note, that for Tycho the proper motion errors are basically defined by the errors of Tycho-2 and the epoch difference to Gaia.
 |
 |
Roughly 10% of the TGAS sample combine small parallax errors with large errors in other astrometric parameters, particularly right ascension. This is a known effect of the Gaia scanning law to date, and should disappear in later releases.
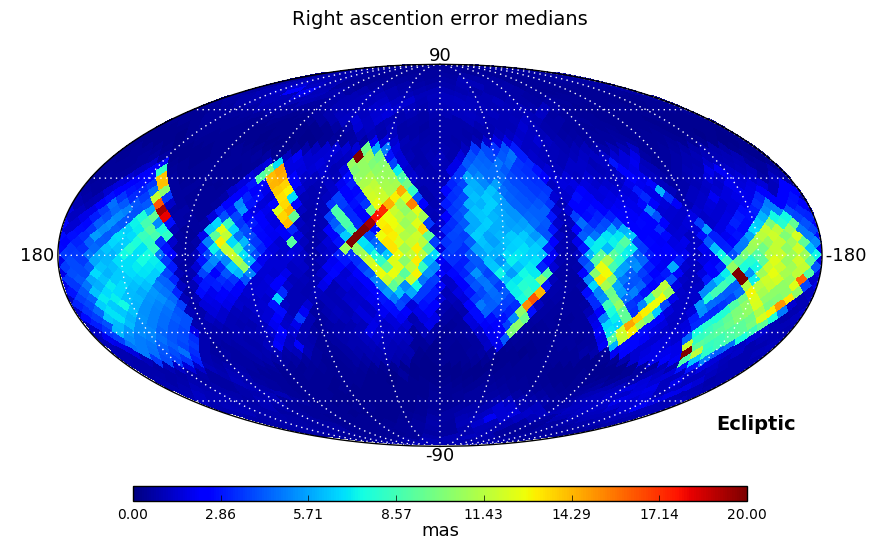
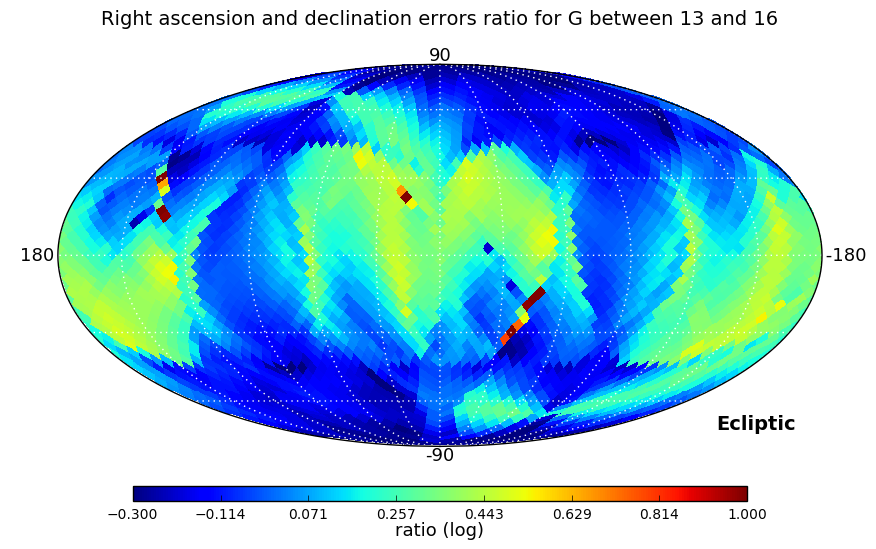
The Gaia DR1 position errors have been analysed from a global perspective in two tests. The first one looks at the sky distribution of the errors as shown in Figure 7.3. As expected, the poorly scanned areas around the Ecliptic plane show the largest errors.
 |
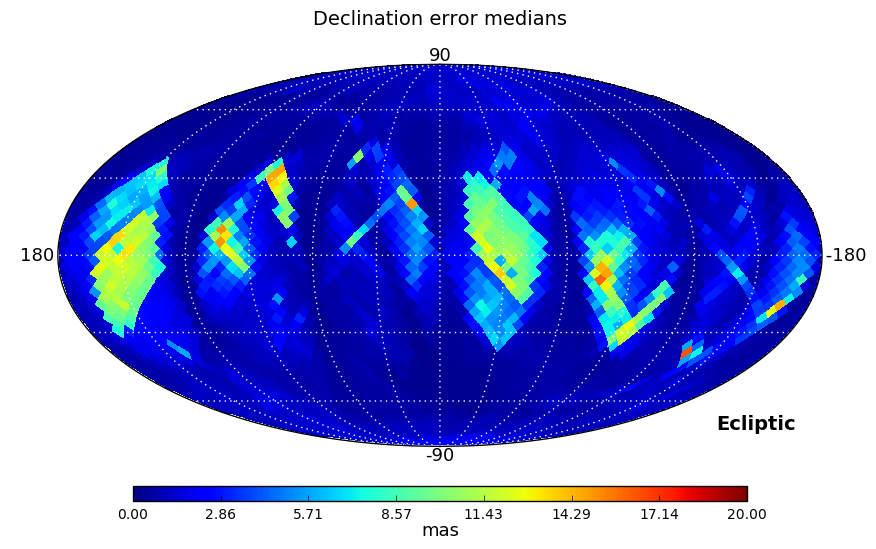 |
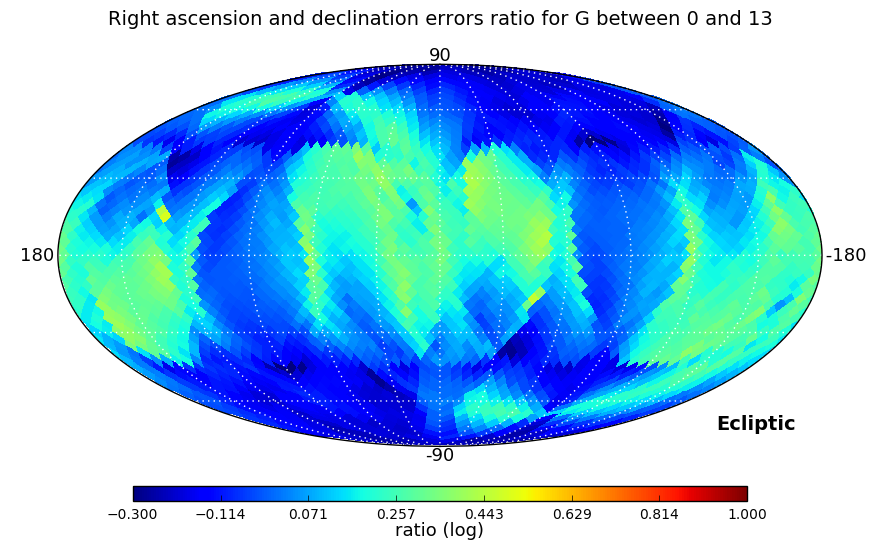
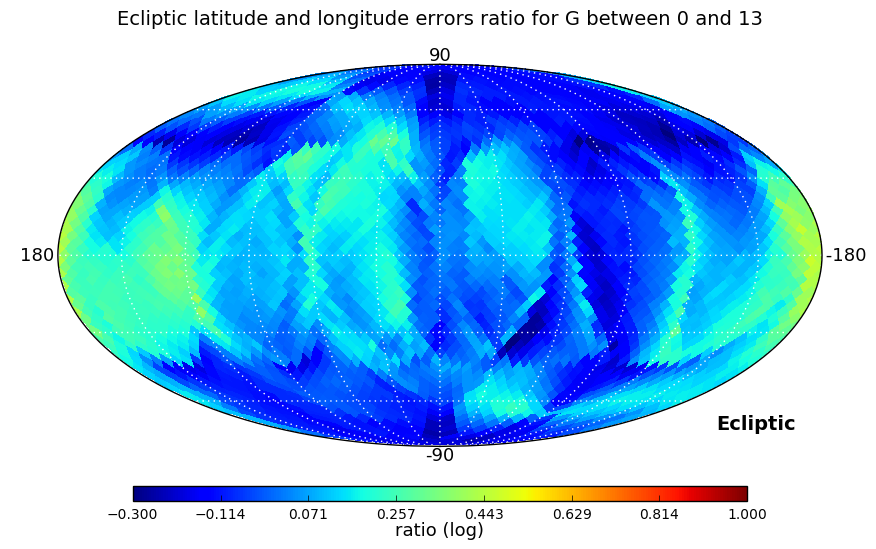
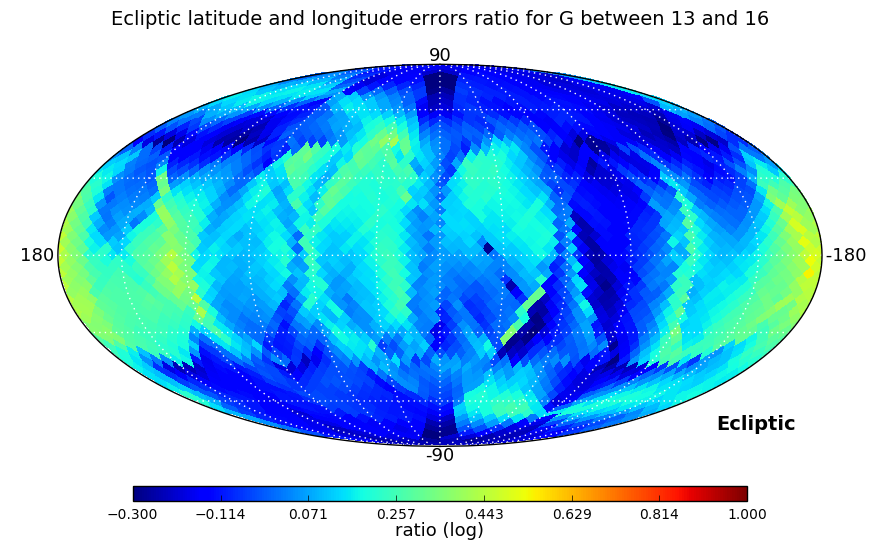
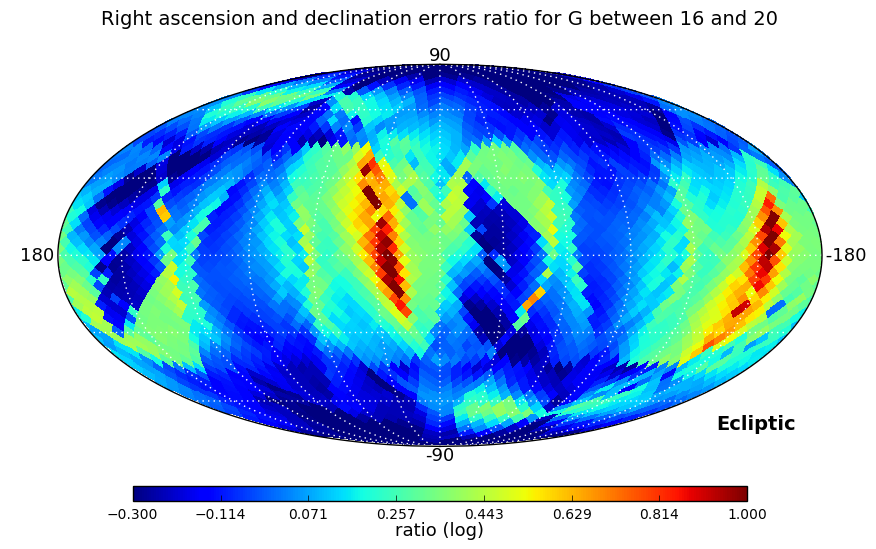
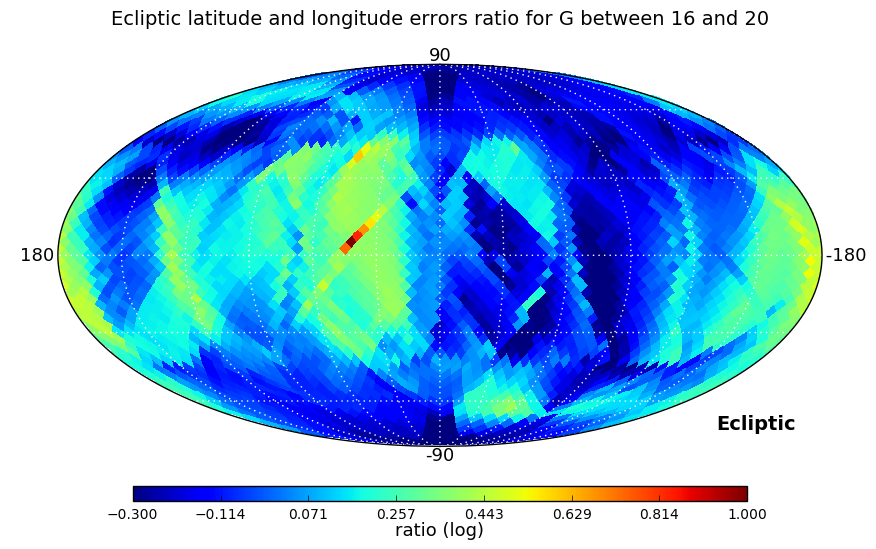
In the second test we looked at the ratio between right ascension and declination errors, and, as errors depend strongly on ecliptic coordinates, also at the ratio of the errors in ecliptic longitude and latitude. These ratios have been computed for three ranges of magnitudes: , , and , and a Kolmogorov-Smirnov test is used to check if the distributions in the three magnitude ranges are similar.
To transform the positional errors to ecliptic coordinates, we need the mutual orientation of the equatorial and ecliptic systems. Following the exposition in the Hipparcos catalogue (Vol. 1, Sect. 1.5.3 of ESA 1997), we denote the basis vectors in the equatorial system as ; with being the unit vector towards , the unit vector towards and the unit vector towards ; and denote basis vectors for ecliptic systems as , then, the direction vector can be expressed in terms of equatorial and ecliptic coordinates as:
| (7.1) |
Then, it is possible to obtain equatorial unit vectors () perpendicular to in the directions of increasing and as defined in Equation 7.2 and Equation 7.3:
| (7.2) |
and
| (7.3) |
The coordinate transformations are treated in detail in Section 3.1.7. The transformation between the equatorial and ecliptic system can be written as
| (7.4) |
where matrix for the present purpose can be approximated with the expression
| (7.5) |
where is the conventional value of the obliquity of the ecliptic.
As in Equation 7.2–7.3, we introduce unit vectors perpendicular to in the directions of increasing and :
| (7.6) |
and
| (7.7) |
We now have the cosine and sine factors for the projections between the two systems:
| (7.8) |
and
| (7.9) |
The uncertainties in ecliptic coordinates are then:
| (7.10) |
and
| (7.11) |
where is the correlation between the errors for the equatorial coordinates.
Distributions analysed by the Kolmogorov-Smirnov test are shown in Figure 7.4. Equatorial and ecliptic errors have been treated separately. In both cases, the higher the magnitude range is, the larger ratios are obtained, but the test confirms that the distributions are essentially the same. The ecliptic errors show lower ratios as the scanning law is symmetric around the Ecliptic.
In addition, we have verified the continuity of the astrometric uncertainties as a function of the mean magnitude in order to check for rapid changes due to the use of different gates. The range of magnitudes taken into account was the one affected by gate effects (below 13 mag). No issues were found for any of the parameters.
Parallaxes
CU9 validation conducted two internal tests of the parallaxes: one aimed at locating sky regions with relatively many negative parallaxes, and one testing the consistency of the standard uncertainty on the parallaxes with the observed parallax distribution.
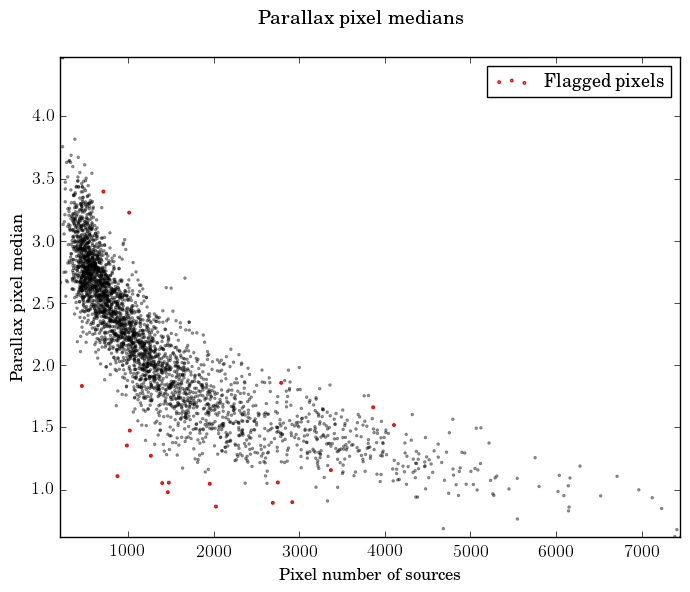
For the first test we compute the fraction of TGAS sources with negative parallax in each level-4 HEALPix pixel (Górski et al. 2005) and flag those HEALPix pixels which have an unusually high or low fraction, given the average number of observations per source. As a result, 150 HEALPix pixels out of 3072 (5%) were flagged. Figure 7.5a illustrates the result, and we particularly notice the high fraction when there are less than 75 observations per source, corresponding to about 8 transits. The right-hand panel shows how the median parallax depends on the star density, where in general in the denser fields (Galactic plane) the relatively bright TGAS stars are further away.
 |
 |
The catalogue validation process checked the internal consistency of the standard uncertainty on the parallaxes by finding the parallax error level most consistent with the observed parallax distribution using a deconvolution algorithm based on Lindegren (1995). This internal estimation of the parallax uncertainty is described in Section 6.2.1 of the Catalogue validation paper (Arenou et al. 2017).
The TGAS parallax accuracy has also been tested using quasars, showing a significant non-null zero-point of the parallaxes together with local systematics, cf. Section 6.1.1 of the Catalogue validation paper.
Proper motions
 |
 |
Different strategies have been taken to test TGAS proper motions. We have looked for problematic sky regions with unusually many high proper motions and also for unrealistic individual proper motions.
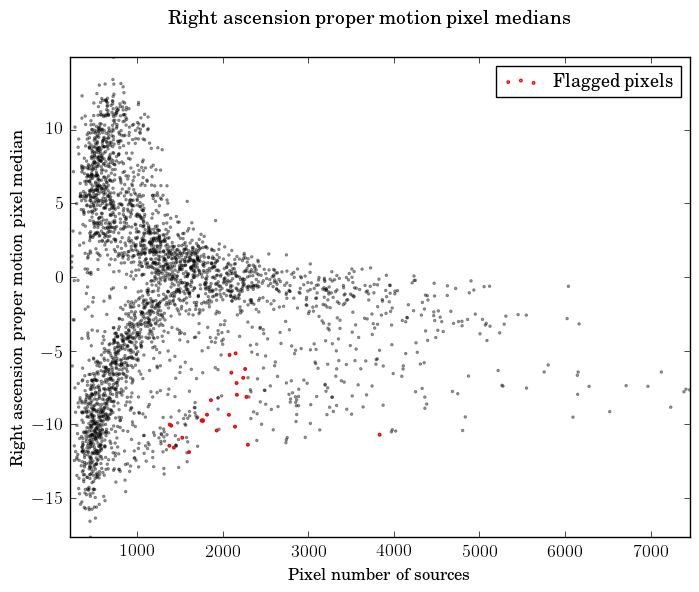
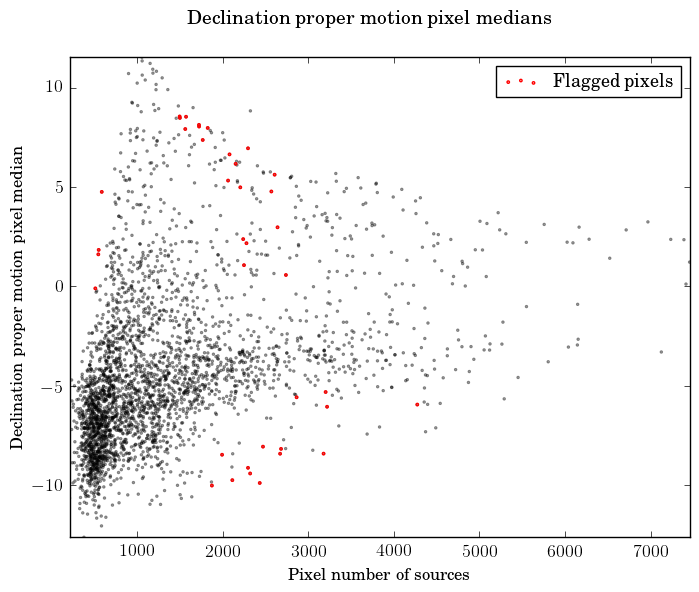
We have taken high proper motion components to mean the ones exceeding mas yr and determined the fraction of such proper motions in each of the 3072 level-4 HEALPix pixels (13.43 square degrees). We then flag as suspicious, the regions where this fraction is more than ten times the global average. As a result we flag seven plus one HEALPix pixels for the right ascension and declination proper motions, respectively.
Individual, high proper motions have been evaluated by computing their tangential velocity components, provided their parallaxes had uncertainties below 20%. We confirmed that no component corresponds to a tangential velocity exceeding significantly the escape velocity at the Sun position, estimated as about 500 km s.
We also looked at the dependence of the median proper motions with the sky density, as illustrated in Figure 7.6. We have flagged regions where the median reaches extreme values given the sky density, but the figure also shows that the flagged regions in reality follow the general distribution. The size of the regions is again 13.43 square degrees.
HEALPix pixel analysis
Test procedures carried out during internal catalogue validation, as described above, are focused on either individual sources or on specific sky regions. In the pixel analysis we summarise where in the sky sources are more often flagged, or where in the sky regions (HEALPix) are more often flagged. This summary was only carried out for TGAS, where more tests were performed.
For the tests based on sources, we find first the fraction of sources in each HEALPix pixel (level 4) that have been flagged at least 3 times in the various tests, see Figure 7.7a. In addition we identify in Figure 7.7b the pixels where this fraction is much higher than in typical pixels. We did a similar test for sources flagged at least 4 times, but these are too few to show a significant result.
For the tests based on sky regions, Figure 7.8a shows the number of times each pixel was flagged, and Figure 7.8b similarly the pixels flagged at least twice.
7.4.3 Confrontation to external catalogues
Author(s): Carine Babusiaux, Catherine Turon
The confrontation of Gaia DR1 with external Catalogues is a tricky task as the Gaia Catalogue is unique in many ways: it combines the spatial resolution of Hubble with a complete survey all over the sky in optical wavelength, down to a -magnitude 20, unprecedented astrometric accuracy and all-sky homogeneous photometric data. However, it is essential to establish the quality and reliability of DR1 data, and the comparison with external catalogues is one way towards a deeper understanding of many of the parameters describing the performance of the Catalogue: overall sky coverage, spatial resolution, catalogue completeness and, of course, precision and accuracy of the different types of data for the various categories of objects observed by Gaia. A special attention is given to the detection of any possible bias, versus sky position, versus magnitude or colour. The objective of this section is to present the many tests made in these directions.
Sky coverage and completeness
The tests presented in this section aim at the characterization of the object content of Gaia DR1:
-
1.
search for duplicate or missing entries;
-
2.
homogeneity of the sky distribution, detection of possible variations in different regions of the sky, for different magnitude, colour or proper motion ranges;
-
3.
small scale completeness of the catalogue for some selected samples and detection of possible variations as a function of magnitude or colour;
-
4.
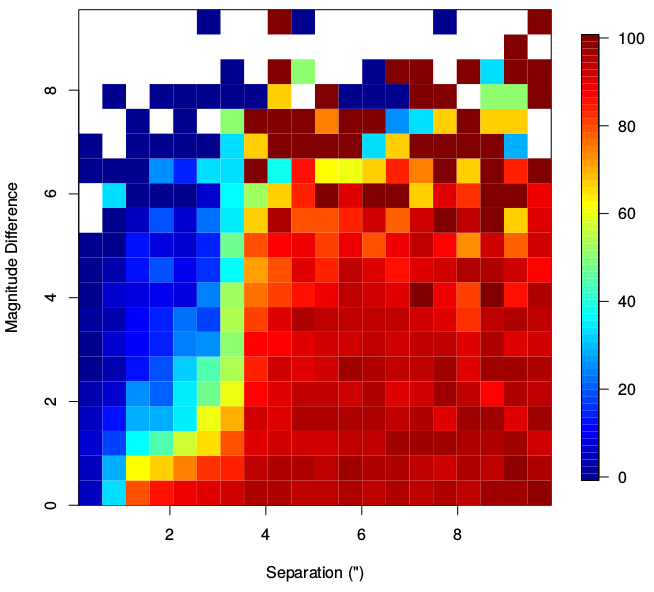
performance of visual binaries observation as an indication of the spatial resolving power of Gaia DR1, tested versus separation and magnitude difference between components.
Overall sky coverage
The overall TGAS content has been tested with respect to the Tycho-2 data while the overall sky coverage of Gaia DR1 has been tested by comparison with two deeper all-sky catalogues: 2MASS and UCAC4. This is described respectively in Sections 4.2.1 and Section 4.2.2 of the Catalogue validation paper (Arenou et al. 2017).
Small scale completeness
The small scale completeness of Gaia DR1 and its variation with the sky stellar density have been tested in comparison with two catalogues: Version 1 of the Hubble Space Telescope (HST) Source Catalogue (HSC; Whitmore et al. 2016) and a selection of fields observed by OGLE (Udalski et al. 2008b), cf. Section 4.3.2 of the Catalogue validation paper.
Spatial resolution
The spatial resolution of the Gaia catalogue is tested using the Washington Visual Double Star Catalogue (WDS; Mason et al. 2001). The results are illustrated by plots of completeness versus separation and 2D plots of completeness versus separation and magnitude difference, presented in Figure 7.9 and in Section 4.4.2 of the Catalogue validation paper.
Non-stellar objects
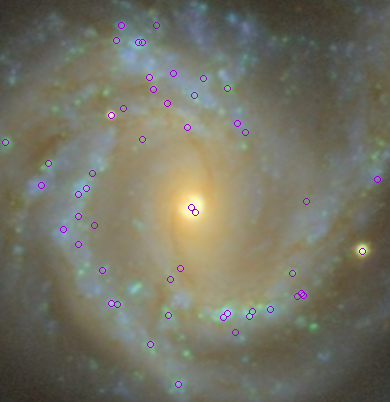
For Galaxies, the crossmatch has been done with SDSS. The properties of crossmatched galaxies have been compared to those of missing galaxies (magnitudes, redshift, axis-ratios and radii). But in Gaia DR1, only 0.2% of the SDSS galaxies are present due to the different filters applied. Still some large resolved galaxies can have multiple detections associated to them, tracing their shape cf. Figure 7.10 and Section 4.2.2 of the Catalogue validation paper.
Astrometric precision and accuracy
The comparison of Gaia results with external astrometric data is not straightforward as Gaia will provide the most accurate astrometric data ever produced, at least in the optical domain. An additional difficulty, especially for the comparison of parallaxes, will be that the numbers of targets will be hugely different: a few tens to a maximum of one hundred thousands for existing data versus millions — and finally a billion — for Gaia. However the consistency between Gaia data and carefully selected external astrometric data might be important in order to detect any statistical misbehaviour in one or the other source of data, including Gaia.
TGAS parallaxes and proper motions
For the validation of TGAS using external astrometric data, the following astrometric catalogues have been considered: Hipparcos new reduction, Tycho-2, High proper motion stars, VLBI compilation, HST compilation, RECONS. The comparisons are described in Section 6.2.2 of the Catalogue validation paper.
TGAS parallax accuracy tested with distant stars
The zero point of the parallaxes and their precision can also be tested directly by using sources (for example stars in the Magellanic Clouds or QSOs) distant enough so that their measured parallaxes can be considered as null according to the catalogue’s expected accuracy (Section 6.1.2 of the Catalogue validation paper).
An estimation of the parallax accuracy has also been obtained with stars distant enough so that their estimated distance through period-luminosity relation or spectro-photometry is known accurately enough. This is described in Section 6.1.3 of the Catalogue validation paper using the period-luminosity relation of Cepheids and RRLyrae, and for catalogues with computable spectro-photometric distance modulus: RAVE DR4, APOGEE DR12, LAMOST DR1, PASTEL, APOKASC.
Gaia DR1 positions and reference frame
For the billion sources of Gaia DR1, the only astrometric parameters available are the two components of the position. The validation of Gaia DR1 astrometry was done using the URAT1, and for QSOs positions with those from the ICRF2 catalogue, as described in Section 6.4 of the Catalogue validation paper devoted to the analysis of the Gaia DR1 positions and reference frame.
Specific tests on known double and multiple systems
In addition to the above general tests, specific tests have also been done on known double and multiple systems, cf. Section 6.2.5 of the Catalogue validation paper.
Photometric precision and accuracy
These tests compare the photometry of Gaia DR1, including TGAS, with external photometry. With the exception of the first test, performed in comparison with the Hubble stellar standards Calspec database, all other tests check the distribution of a mixed colour index Gaia magnitude minus the external catalogue magnitude in ordinate versus an external catalogue colour in abscissa. An empirical robust spline regression is derived which models the global colour-colour relation. The residuals from this model are then analysed as a function of magnitude, colour and sky position.
This is described in Section 7.3 of the Catalogue validation paper using HST CALSPEC standard star database, photometric standard stars, Hipparcos magnitudes, SDSS photometry, Tycho-2 photometry and 2MASS photometry.
7.4.4 Validation using open clusters
Author(s): Antonella Vallenari, Tristan Cantat-Gaudin, Rosanna Sordo, Paola M. Marrese
Distant clusters are convenient validation tools, offering a sample of stars for which the distance and kinematics can be assumed to be similar within a small dispersion. Tests on proper motions and parallaxes have been performed on a selected list of open clusters. Photometry consistency and data completeness made use of a set of globular clusters.
Testing proper motions
The aim of this test is two-fold: assessing the internal consistency of proper motions within stellar clusters, and looking for biases and systematics by testing the proper motions zero-point against literature values. Results are shown in Section 6.2.4 of the Catalogue validation paper (Arenou et al. 2017).
Testing parallaxes
This test aims at assessing the internal consistency of parallaxes within a cluster, and checking the parallaxes against photometric distances in order to verify the zero-point of parallaxes. The procedure is analogous to the proper motion test described in 7.4.4 and the results are discussed in Section 6.1.4 of the Catalogue validation paper.
Testing completeness
The aim of this test is to assess the completeness of the catalogue in crowded regions comparing Gaia data with HST photometry. We focused on very dense regions, in the inner 3 arcmin 3 arcmin of the cores of a sample of 26 globular clusters. The data were acquired with the Wide Field Channel (WFC) of the Advanced Camera for Surveys (ACS) in the filters F606W and F814W. The tests are illustrated in Section 4.3.2 of the Catalogue validation paper together with the other tests using external catalogues.
Testing photometry
The goal is to test the photometric accuracy and precision of Gaia against published photometry of stellar clusters. We made use of a sample of high quality photometry in band, highly homogeneous, both in data reduction and in zero point for all the clusters, for 5 open clusters, namely Hyades, Praesepe, Coma Ber, NGC752 and M67. In addition, we used M4 HST photometry. The results are shown in Section 7.4 of the Catalogue validation paper.
7.4.5 Comparison to models
Author(s): Annie Robin
The Gaia mission provides more data than ever. Although many stars observed by Gaia have already been detected, the astrometric parameters are often totally new. Moreover parallaxes have been obtained for so few stars, although distances are estimated for slightly larger numbers of stars. Hence, the validation of the proper motions and parallaxes of Gaia cannot be uniquely done by comparison to existing data.
Models contain a summary of our present knowledge about the stars in the Milky Way. This knowledge is obviously imperfect and one expects many of the discrepancies between model simulations and real Gaia data to be due to the models themselves. However, at the level of our current knowledge, if a model performs sufficiently good accuracy compared to existing data, it can be used for Gaia validation (at the level of this accuracy). This is what we are doing in this set of tests. These tests supersede the validation with existing data in regions of the sky where data are too scarce, or in magnitude range where existing data are not accurate enough or incomplete, or in case they do not exist in large portions of sky (parallaxes).
On Gaia DR1, we performed 3 kind of tests: tests on stellar densities, tests on proper motions, and tests on parallaxes. In all tests we analyse the distribution on the sky of the model densities, and statistical distribution of astrometric parameters (proper motions and parallaxes) and compare with Gaia data. In order to establish a threshold for test results we compared the model with previous catalogues on portions of sky when available. For this first data release we used only the Besançon Galactic Model (BGM) to compare with Gaia data.
The model and the method used are further described in Sections 2.3 and Section 4.2.3 of the Catalogue validation paper (Arenou et al. 2017).
TGAS validation
Two BGM simulations have been done for TGAS validation, using slightly modified models, both in density laws and kinematics, in order to verify the dependency of the model inputs to the validation. Both simulations were done with the model described in Czekaj et al. (2014) where the evolutionary scheme has been updated, as well as the IMF, SFR and evolutionary tracks. moreover, the thick disc and halo populations have been updated, following Robin et al. (2014), with new density laws. Concerning the kinematics, we used alternatively the standard model kinematics Robin et al. (2003), hereafter BGMBTG2, and a revised kinematics from an analysis of RAVE survey, hereafter called BGMBTG4. BGMBTG2 and BGMBTG4 also differ by several model parameters such as the extinction model and thin disc scale lengths. The use of two different models allows to evaluate what is due to acceptable model variations in the parallax and proper motion distributions.
Parallaxes
The mean parallax differences between the BGMBTG2 simulation and TGAS data, as a function of latitude is discussed in Section 6.3.1 of the Catalogue validation paper.
Proper motions
The differences in the mean proper motion along galactic longitude between the BGMBTG2 and BGMBTG4 simulations and the TGAS data are described in Section 6.3.2 of the Catalogue validation paper.
Gaia DR1 completeness
Since Gaia DR1 contains only magnitude and positions, the validation with models consists in comparing the distribution of star density on the sky with a realization of the BGM one specifically for this purpose. It includes single stars, multiple systems, and incorporate a model for the expected errors on stellar parameters after the full 5 year Gaia mission. In the validation process, star counts as a function of positions and in magnitude bins are compared and shown in Section 4.2.3 of the Catalogue validation paper.
7.4.6 Multidimensional analysis
Author(s): Amina Helmi
Multi-dimensional statistical analyses of the Gaia catalogue have been performed. For the validation of the TGAS and Gaia DR1 datasets, the aim has been to check that the amplitude of the correlations and degree of clustering amongst observables themselves (and also with their errors) are consistent with expectations based on models (e.g., GOG, Simu-AGISLab simulations) or published datasets (e.g., RAVE, etc.).
Rationale
The statistical tests performed make use of the Kullback-Leibler Divergence (KLD), also known as “mutual information”, and allow for estimation of the degree of correlation or clustering in spaces that are combination of any number of the observables and of their errors. Given two distributions and the KLD is defined as
| (7.12) |
i.e., this statistic compares the information content of with respect to . In the tests reported below, is defined as the 1-dimensional marginalised distribution of each observable (or independent variable). That is, if , then where . If there is clustering or correlations between the variables, then will be large, while it will be zero if they are uncorrelated.
The tests described below have been applied only to two-dimensional subspaces (i.e., pairs of observables). Since certain subspaces are known to be naturally clustered, for example in the subspace of ra vs dec stars are not randomly distributed, there is a need to compare to simulations or models to establish whether the KLD value obtained is reasonable or not, and hence the subspace should be flagged. Therefore, the values of the KLD are themselves not used in an absolute sense in the tests below, but they are ranked. It is their rankings that are then compared to the simulations or models, or other datasets.
Summary of test results
TGAS and comparison to Simu-AGISLab simulations
The mutual information ranking of the 2D subspaces from the TGAS data versus the ranking of the same subspaces in the AGISLab simulation is discussed in Section 5.2.1 of the Catalogue validation paper (Arenou et al. 2017).
TGAS comparison in different sky regions
To check for the presence of systematics in the data, a comparison has been done for regions with a similar number of observations or symmetric with respect to the Galactic plane or centre and are described in Section 5.2.2 of the Catalogue validation paper.
Parallax accuracy using spectrophotometric parallaxes
A crossmatch was done between RAVE (Binney et al. 2014) and TGAS by finding the nearest stars within 1 arcsecond. Out of TGAS stars and RAVE stars, we find common stars. The accuracy of the TGAS parallax using spectrophotometric parallaxes is discussed in Section 6.1.3 of the Catalogue validation paper devoted to the parallax accuracy tested with distant stars.
Gaia DR1 comparison to GOG simulations
The rankings obtained for the observables and their errors in the full Gaia DR1 Catalogue is discussed in Section 5.2.3 of the Catalogue validation paper.
7.4.7 Time series and variability
Author(s): Sergi Blanco-Cuaresma
Objects with intrinsic or extrinsic variability (such as Cepheids and eclipsing binaries) may affect the Gaia data analysis. For instance, variations in luminosity complicates the crossmatching of sources, leading to a wrong determination of physical parameters. In the opposite sense, the instrument and/or the data processing can also introduce false variability that might be interpreted as real. This aspects has been taken into consideration to implement a set of tests which verify that no significant statistical biases are present on the Gaia catalogue.
Testing light curves of variable stars is described in Section 7.5.1 of the Catalogue validation paper (Arenou et al. 2017) and the result of the comparison of the distribution of variable to constant stars is discussed in Section 7.5.2 of the Catalogue validation paper.